F1blogtech

F1blogtech

venerdì 20 aprile 2018

The performance analysis of the 2018 Chinese Gp


                          TYRES' LOTTERY


Written by Gianluca Medeot


Shanghai, April 15th 2018. An eventful race that covered a qualification in which it has been outlined. an interesting but at the same time complex technical framework. 
So, let's analyze what there is behind teams' performance ( we will consider the 10 car qualyfied in Q3).


In order to have  a clearer and more effective analysis it is essential to outline the characteristics of the Chinese track: it is a medium / high downforce circuit and medium severity for thrusters (traveling at fully open throttle for approximately 56% of the lap).
The first sector is very slow and traction is critical. On the contrary, the second, is a fast sector with two large-radius curves in which much load and especially a correct aerodynamic balance are needed to prevent harmful phenomena of understeer. The third is instead formed by a stretch of  1.3 km where there is needed a lot of straight efficiency (the union between PU's power and cx), with a final section (the last and penultimate curve) in which traction is again very important.


The charts with percentages detachment from pole position don't provide us with particular issues for analysis, but they outline Mercedes' and Red Bull's negative trend of the last GPs. All the second range team maintain their trend , with the exception of Toro Rosso which gained a 3% detachment after the positive exploit in Bahrain.

The element that has probably influenced the most cars' performances during the weekend was definitely the continuous change of track temperature: 20° on Friday, 15° on Saturday (there were also gusts of wind) and 40° on  Sunday. The thermal excursion was really high and very difficult to handle for the team, considering the very strice " temperature windows" in which  the 2018 tires work. This element, combined with the length of the main straight, made very difficult for the drivers to keep the tires in this operating window.
From the graph with the comparison between the real times recorded in Q3 and "ideal" times we can see these difficulties.  Only two Q3's drivers( Vettel and Perez) managed to score their best time in the crucial moment. 
We must underline that Raikkonen  had "in his foot" the chance to make pole position.


It is very interesting to analyze the maximum speeds recorded at the speed trap. It is very clear  the differentation of set up between the two Ferraris, with Vettel who went for slightly lower load. The microsector map proposed by Fom, shows clearly the predominance of Vettel in the straights, that in chronometric terms pay a lot on this particular track. 
Mercedes aligns to Ferrari datas confirming pairing in terms (on qualifying maps ) of power between the two PUs. This is a  very important signal for Ferrari, which will now have to focus on the efficiency of race's mapping to avoid those stint in which drivers are forced to carry out an obvious fuel-saving.


Analyzing the percentages detachments in the different sectors, we can notice  that the Ferraris are faster in every intermediate, but they really made the difference with the silver arrow in the first one
A detachment of more than one percent for both Mercedes drivers. A surprising data  because in the second sector, which has practically identical characteristics, the gaps appear to be much more light.
The most plausible explanation could be a lack of temperature on the tires.
This observation provides us the opportunity to briefly talk about the problem that I have mentioned before. 
In the Q2 Mercedes marked a super competitive lap with the  Soft before improving only two tenths with the Ultrasoft. In Australia with Supersoft it was uncatchable in qualifying, but it then sunk in Bahrain always with the same compound.
Competitive within the averages in Bahrain, and fearful in China in mounting the Soft in the race fearing the an overheating. 
It's clear that the main W09's problem (for now)  is to keep the tires in the right temperature window. 
It should however be emphasized that also the other teams have similar difficulties.
Ferrari outlined very different behaviors in different Gp, but also between the different sessions.
So it is clear clear that the "tire factor" will represent a great wild cart in the  2018 championship because of the very tight operational windows of these new tires (at the bottom you will find a summary table of the different tires). 
It is difficult to give an explanation to such problems highlighted by Mercedes. If in fact the most rigid set-up dictated by the use of a less pronounced rake could justify the overheating phenomena with low working range tires, through the external analysis is more difficult to justify the problems to bring them to the temperature shown in China.
Nothing to add for Ferrari which was perfect in the qualifying lap, precise insertion in curve and no signs of oversteer, all confirming the progressive refinement throughout the mechanical set-up carried out by the team.
Important to mention the Red Bull that finally had the opportunity to show its potential in the race, waiting for a street circuit where it can really show off its frame capabilities, constantly hidden by the PU power gap.
Looking at  the graphs we can  see that obviously the third sector is the one in which they lost more time, then settling in the first and second almost to the levels of Mercedes. 
A  remarkable data  considering the very low angles of incidence of the wings used in order not to lose too much in a straight line (matched then with a pronounced rake and the use of a refined third hydraulic element that perfectly manages of the height of the car from the ground).
For the moment its all folks, see you in Baku!!! ;)


Temperature range for the different compounds


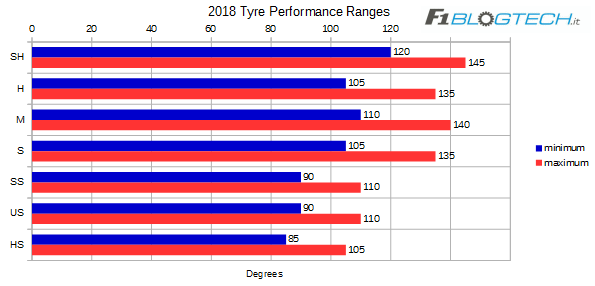
                          RACE'S GRAPHICS (edited by Niccolò Arnerich)


FRIDAY SIMULATION

Very low temperatures of the track during simulations made on Friday. The temperature of the asphalt roamed, in fact, about 14 ° C. From the long runs it has shown that the safest strategy was a one-stop strategy, starting with S before moving to M. This is because the UltraSoft seemed to have a rather high degradation, with an anticipated cliff, which would have addressed the race on two stops and not on one. 
Ferrari and Mercedes have decided to qualify in Q2 with Soft tires, unlike Red Bull, who qualified with the US , to try the two-stop strategy.

The strategies were still very similar, as can be seen from the graph below, but the US was partly unknown because it was not sure he could make the strategy work at a stop sign.

We remind that the Pirelli decided to bring here Medium, Soft and Ultrasoft.


THE RACE STRATEGY:


 TRACK  CONDITIONS
Very different track conditions on Sunday. Temperatures were in fact much higher and fluctuated about 39 ° C. 


THE START OF THE GRAND PRIX
Good start for Vettel who immediately went to forcefully close the door to Raikkonen. Bottas was then able to overtake the Finn into the first corner and this fact did gave the race a very different direction from the one that could have taken in terms of strategy, having two Ferraris in charge. 

THE FIRST STINT 
In the first stint Vettel managed to create a 3s gap on Bottas and both because  he had clean air in front of him, and  staying in the slipstream of another car for more laps was not very "healthy" for the W09.

Standing in the wash of another car causes infact an overheating of the compound, as well as an overheating of the components of the Power Unit, which causes a greater degradation of the compound and a rise in temperature. 
Hamilton was close to Raikkonen just managing to get close before the stop.

Verstappen held a rhythm with the US worse than that of Ferrari and Mercedes on S. His pace was not good at all if you think that his strategy was marked by two stop and therefore, to make it work, he wshould have had to run on much fester lap-times. It can also be assumed that RedBull's pitwall was trying the one-stop strategy US-M, with an advantage during the starting phase thanks to the greater grip of UltraSoft, and that therefore the Dutch was trying to lengthen the life of this compound; eventually they definitely opted for two stops as their first stop took place too early, on lap 17.  The Same was for the RB14 Ricciardo, who was also on the same strategy. 


From the graph with the the fuel weight effect correction it is clear that Raikkonen has had a lower degradation compared to Vettel-Bottas couple, who has had a rather similar degradation, slightly more pronounced on the Finnish car. Ricciardo with the US, however, has suffered a much greater degradation.


THE SECOND AND THIRD STINT (OF REDBULL) 
The first to stop to go to the second stint were the Red Bulls. For both drivers it was mounted a M in a double pit stop. Ricciardo has also earned the position on Raikkonen, who has been out for much longer on the Soft tire. 
Raikkonen stayed out until lap 27 to try to have an advantage in the last stint, on average, after the undercut tested by Hamilton had worked. Because of that he lost his position both on Hamilton and Ricciardo. He later had the advantage of having a new tire when the group was bunched up because of the lap 31 SC.

Looking at  the  Vettel-Bottas couple in command, Mercedes' strategists , under the command of James Vowles,  decided to try the undercut with Bottas, then having a stop on lap 19. The undercut on paper was very difficult because the gap was well-over 3s. Bottas, however, did a very good lap and, helped by slow stop by Vettel in the next lap (1s exact total more slow times are measured in pit lane), he came out ahead of the German who, in later rounds,  tried invain to overtake on the track. Plus, by analyzing Vettel's lap, it can be noticed that the rubber began to degrade and therefore most a few tenths were  lost at this stage. The Ferrari's wall would have to defend itself before stopping their driver and neutralizing Mercedes' undercut attempt.

On lap 31 the SC entered for the contact in corner 14 between Hartley and Gasly. This was the golden opportunity for the two RedBull that, by stopping, lost less time for the second pit stop and found themselves with a fresh S tire for the final stint. Vettel, Bottas and Hamilton have not taken advantage of this SC because when output had already passed what the team called "Safety Car Line 1" that is the pit entry. 

Both Ferrari and Mercedes failed to show the delta between the two compounds that is very  important to determine the stop. On paper the ground lost with this option will not balance positions theoretically gained later so they had to stay out. 

Hence  Ricciardo's  and Verstappen  recovery which leads the Australian to win the grand prix. The two Mercedes and Vettel still had the  Medium rubber which was less performing than the Soft in that arc race. 

Highlighting Ricciardo's comeback in the central part of the graph who lifted his time managing the gap created. It is also known as Vettel has greatly raised its timing, because of the Medium degradation, and especially at the end of the stint because of the floor's damage (caused by the contact with Verstappen).


We can notice from these graphs of the degradation that the Mercedes made better use of the compounds with higher temperature window, between 100 ° and 140 °, much higher compared to compounds such as the US or the SS. The compounds are very sensitive and to work well they must remain in their proper range. A few degrees can therefore significantly change car's performance. Mercedes is having some problems from this point of view also in the race, but the problem is reduced with higher range compounds.


This is the graph in which are represented the paces of Vettel's race, Raikkonen, Bottas and Ricciardo. This chart does not take into account the Fuel Weight Effect.


Here, instead, the chart representing the steps race with the correction of the Fuel Weight Effect namely the loss of weight due to fuel consumption during the race. 


Another very useful chart to see the actual degradation that has had the tire during the race.


Through this chart you can view the strategies used by the riders in the race. In the second one are underlined the paces of Vettel, Botaas Raikkonen and Ricciardo during the stints.


THE MINOR TEAMS 
Now, as always, we will examine the graphs for some teams that stand out during the Chinese GP. The charts then take into account the whole race Hulkenberg, Alonso, Magnussen and Ocon. 


Here, instead, the graph representing the race pace with the correction of the Fuel Weight Effect namely the loss of weight due to fuel consumption during the race.


Finally the graph of the development of degradation lap by lap of the second group of riders
 

giovedì 19 aprile 2018

L'analisi prestazionale del Gp della Cina 2018

               TOTO GOMME                 


di Gianluca Medeot

Shanghai, 15 Aprile 2018. Una gara movimentata che ha fatto discutere e ha coperto una qualifica in cui si è delineato un interessante ma al contempo complesso quadro tecnico. 
Andiamo dunque ad analizzare cosa si cela dietro le performance delle diverse squadre (verranno prese in esame le dieci vetture entrate nel Q3).


Mappa FIA del circuito


In primis al fine di un analisi più chiara ed efficace risulta fondamentale delineare le caratteristiche del tracciato cinese. È un circuito da medio/alto carico aerodinamico e di media severità per i propulsori (si viaggia a gas pienamente aperto per circa il 56% del giro ).
Il primo settore è molto lento e risultano fondamentali gli sforzi di trazione. Il secondo, è invece un settore veloce con due curve ad ampio raggio in cui c'è bisogno di tanto carico, ma soprattutto un di corretto bilancio aerodinamico in modo da evitare nocivi fenomeni di sottosterzo. Il terzo intermedio è formato invece da un allungo di ben 1,3 km dove c'è bisogno  di efficienza (intesa come connubio tra potenza della PU e cx), con una sezione finale (ultima e penultima curva ) in cui sono di nuovo molto importanti gli sforzi di trazione.


Distacco percentuale rispetto alla pole position (Mercedes, Ferrari e Red Bull)

Distacco percentuale dalla pole position (Mclaren, Hass, Renault, Toro Rosso e Force India)

I grafici con i distacchi percentuali dalla pole position non ci forniscono ancora particolari spunti di analisi, ma delineano comunque il deciso trend negativo per la Mercedes e la Red Bull negli ultimi Gp. Si mantengono su trend simili i team di seconda fascia, con l'eccezione della Toro Rosso che ritorna ad un distacco del 3% dopo l'exploit positivo in Bahrain.

Confronto tra il giro realmente segnato in Q3 e il giro "ideale" dato dalla somma dei migliori tempi registrati nei tre settori.
L'elemento che probabilmente ha influenzato di più le performance delle vetture durante il weekend è stato sicuramente il continuo cambio di temperature della pista. 20° al venerdì, 15° al sabato (da sottolineare anche la presenza di raffiche ventose) e ben 40° alla domenica. L'escursione termica è stata davvero grande e molto difficile da gestire per i team, considerando le ristrette finestre di temperatura in cui lavorano i pneumatici 2018. Questo elemento, abbinato al lunghezza del rettilineo principale, ha reso davvero difficile per i piloti mantenersi in questa finestra operativa delle gomme. 
Proprio dal grafico con il confronto tra i tempi reali segnati nel Q3 e i tempi "ideali" possiamo notare queste difficoltà. Dei 10 piloti entrati nel Q3 solo due (ovvero Vettel e Perez) sono riusciti a segnare i loro tempo migliore nel momento fondamentale. 
Molto importante sottolineare che Raikkonen aveva "nel piede" la possibilità di fare pole position.
Confronto tra la posizione di qualifica e la velocità massima registrata alla speed trap
Risulta molto interessante analizzare le velocità massime registrate alla speed trap. Si evidenzia subito una differenziazione di set up fra i due Ferraristi, con Vettel che ha puntato per un assetto leggermente più scarico. La mappa dei microsettori proposta dalla fom, evidenzia una chiara supremazia di Vettel sui rettilinei, che in termini cronometrici paga molto su questa particolare pista. 
Mercedes si allinea ai rilievi Ferrari confermando l'appaiamento in termini di potenza in mappatura da qualifica fra le due PU. Segnale molto importante per la Ferrari, che ora dovrà concentrarsi sull'efficienza del motore in mappatura da gara così da evitare quegli stint in cui i piloti sono costretti ad attuare un evidente fuel-saving.

Analizzando i distacchi percentuali nei vari settori, notiamo che le Ferrari sono risultate più veloci in ogni intermedio, ma in particolare hanno fatto la differenza rispetto alle frecce d'argento nel primo.
Un distacco sopra l'un percento per entrambi i piloti Mercedes. Un dato che sorprende visto che nel secondo settore, che presenta caratteristiche praticamente identiche, i distacchi risultano essere molto più contenuti.
La spiegazione più plausibile per tutto ciò è una mancanza di temperatura sulle gomme, entrate poi nella giusta finestra termica solo dopo le prime curve.
Questa osservazione offre lo spunto per parlare brevemente del problema di cui vi ho accennato qualche riga fa. 
Nel Q2 la Mercedes ha segnato dei tempi super competitivi con la soft per poi migliorare di soli due decimi con le ultrasoft. In Australia con Supersoft era risultata imprendibile in qualifica, per poi affondare in Bahrain sempre sulla stessa mescola.
Competitiva con le medie in Bahrain, e timorosa in Cina nel montare le soft in gara per paura dell'overheating. 
E' evidente che il problema (attualmente) più grande della W09 è riuscire a tenere le gomme nella giusta finestra di utilizzo. 
Va però sottolineato che anche le altre scuderie trovano difficoltà simili, seppur non così marcate.
La stessa Ferrari ha delineato comportamenti molto differenti nei diversi Gp, ma anche fra le diverse sessioni.
E' dunque evidente che il fattore gomme rappresenterà una grande incognita nel mondiale 2018 a causa delle ristrettissime finestre operative di queste nuove gomme (in fondo troverete una tabella riassuntiva delle varie gomme). 
Difficile dare una spiegazione a tali problematiche evidenziate dalla Mercedes. Se infatti i set up più rigidi dettati dall'utilizzo di un rake meno pronunciato potrebbero giustificare i fenomeni di overheating con gomme low working range, tramite un'analisi esterna risulta più difficile giustificare i problemi a portarle in temperatura evidenziati in Cina.
Niente da aggiungere per la Ferrari che di fatto è risultata perfetta nel giro di qualifica, precisa in inserimento curva e mai sovrasterzante, il tutto a conferma del progressivo lavoro di rifinitura del set up meccanico portato avanti dal team.
Importante menzionare anche la Red Bull che finalmente ha avuto occasione di dimostrare le sue potenzialità in gara, in attesa di un circuito cittadino in cui poter realmente sfoggiare le doti telaistiche, continuamente nascoste dal gap di potenza della PU.
Dai grafici notiamo che ovviamente il terzo settore è quello in cui ha perso più tempo, assestandosi poi nel primo e nel secondo quasi ai livelli di Mercedes. 
Un dato notevole considerati i bassissimi angoli di incidenza delle ali utilizzati allo scopo di non perdere troppo in rettilineo (abbinati poi all'assetto rake pronunciato e all'utilizzo di un raffinato terzo elemento idraulico che gestisce al meglio l'altezza della vettura da terra).

Per il momento è tutto, ci vediamo a Baku per qualche novità dal toto gomme. 
Ciao e always keepushing!! ;)


Range di temperatura per le diverse mescole

Componenti della Power Unit utilizzati da ogni pilota

Punti nel campionato costruttori


                          GRAFICI SULLA GARA (a cura di Niccolò Arnerich)


LE SIMULAZIONI DEL VENERDÌ

Molto basse le temperature del tracciato durante le simulazioni fatte il venerdì. Le temperatura dell'asfalto si aggiravano, infatti, sui 14°C. Dai long run è emerso che la strategia più sicura era quella a una sola sosta partendo con la S per poi passare alla M. Questo perché la gomma UltraSoft sembrava avere un degrado piuttosto elevato, con un cliff piuttosto anticipato, che avrebbe indirizzato la gara su due soste e non su una sola. 

Ferrari e Mercedes hanno quindi deciso di qualificarsi nella Q2 con la gomma Soft, a differenza della Red Bull, che si è qualificata con la US, per provare la strategia a due soste.


Le strategie erano comunque molto simili, come si vede dal grafico sotto, ma la US era in parte un’incognita perchè non era sicuro potesse far funzionare la strategia ad uno stop.

Ricordiamo che la Pirelli ha deciso di portare qui la la gomma Medium, Soft e Ultrasoft e non la Supersoft come era più logico pensare.


LA STRATEGIA DI GARA:

LE CONDIZIONI DEL TRACCIATO

Molto differenti le condizioni della pista la domenica. Le temperature sono state infatti molto più alte e hanno oscillato sui 39°C.
LO START DEL GRAN PREMIO
Buono lo start di Vettel che è andato subito a chiudere con forza la porta a Raikkonen. Bottas è quindi riuscito a sopravanzare il finlandese alla prima curva e ciò ha fatto prendere alla gara una direzione molto diversa da quella che avrebbe potuto prendere in termini di strategia, avendo due Ferrari al comando.

IL PRIMO STINT 
Nel primo stint la SF71H di Vettel è riuscita a creare un gap di 3s sulla Mercedes di Bottas sia per il fatto che aveva aria pulita davanti a sé, sia perché stare in scia ad un altra vettura per più giri non era molto “salutare” per la W09 del finlandese.

Stare in scia di un’ altra vettura provoca di fatto un surriscaldamento della mescola, oltre ad un surriscaldamento dei componenti della Power Unit, che determina un degrado maggiore della mescola e un innalzamento della temperatura della stessa.
Hamilton si è tenuto vicino a Raikkonen riuscendo ad avvicinarsi poco prima dello stop.

Verstappen ha tenuto un ritmo con la US più alto rispetto a quello di Ferrari e Mercede sulla S. Il suo ritmo non è stato per niente buono se si pensa che  la sua strategia era improntata su due soste e che quindi, per farla funzionare, avrebbe dovuto girare su tempi ben più bassi. Si può anche ipotizzare che il muretto RedBull stesse provando la strategia ad una sosta US-M, con un vantaggio durante la fase di partenza grazie al maggior grip della UltraSoft, e che quindi l’olandese stesse cercando di allungare la vita di questa mescola; alla fine hanno sicuramente optato per le due soste visto che il loro primo stop è avvenuto troppo presto, al giro 17. Stesso discorso per la RB14 di Ricciardo, anche lui sulla stessa strategia.


Dal grafico con la correzione dell’ Effetto peso si nota che Raikkonen ha avuto un degrado più basso rispetto alla coppia Vettel-Bottas che ha avuto un degrado piuttosto simile, leggermente più accentuato sulla vettura del finlandese. Ricciardo con la US, invece, ha accusato un degrado nettamente maggiore. Si nota anche come Vettel abbia spinto di più nei giri iniziali della corsa.


IL SECONDO STINT E IL TERZO (DELLA REDBULL)
I primi a fermarsi per passare al secondo stint sono stati i Red Bull. Per entrambi i piloti è stata montata la gomma S in un doppio pit stop. Ricciardo, inoltre, ha guadagnato anche la posizione su Raikkonen, il quale è rimasto fuori molto più a lungo sulla gomma Soft.
Raikkonen è rimasto fuori fino al giro 27 per provare ad avere un vantaggio nell’ultimo stint, su Media, dopo che l’undercut provato da Hamilton aveva funzionato. A causa di ciò ha perso la posizione sia su Hamilton sia su Ricciardo. Successivamente ha avuto il vantaggio di avere una gomma nuova quando il gruppo è stato ricompattato a causa della SC del giro 31.

Per quanto riguarda la coppia Vettel-Bottas al comando, gli strateghi Mercedes, sotto il comando di James Vowles, hanno deciso di provare l’undercut con Bottas, fermandosi quindi al giro 19. L’undercut sulla carta era molto difficile perché il gap era di ben 3s. Bottas ha però fatto un giro molto buono e, aiutato anche da uno stop non velocissimo di Vettel al giro successivo (1s esatto in totale piú lento misurando i tempi in pit lane), è uscito davanti al tedesco il quale, nei giri successivi, ha provato invano a sorpassarlo in pista. Oltre a ciò, analizzando il giro di rientro di Vettel si nota che la gomma incominciava a degradare maggiormente e perciò qualche decimo è stato perso anche in questa fase. Il muretto Ferrri avrebbe dovuto difendersi meglio fermando prima il loro pilota e neutralizzando il tentativo di undercut Mercedes.

Al giro 31 è entrata la SC per il contatto alla curva 14 tra Hartley e Gasly. Questa è stata l’occasione d’oro per le due RedBull che, fermandosi, hanno perso meno tempo per il secondo pit stop e si sono trovati con una gomma S fresca per l’ultimo stint. Vettel, Bottas è Hamilton non hanno usufruito di questa SC poiché quando è uscita avevano già passato quella che i Team chiamano "Safety Car 1 Line" ossia la pit entry.

Tra l'altro, sia Ferrari che Mercedes non avevano evidenziato un delta tra le due mescole così importante da determinare lo stop. Sulla carta le posizioni perse con questa scelta non bilanciavano le posizioni teoricamente guadagnate in seguito e perciò hanno deciso di rimanere fuori 

Da qui la rimonta di Ricciardo e di Verstappen che porta l’australiano a vincere il gran premio. Le due Mercedes e Vettel avevano ancora la gomma Medium che era notevolmente meno prestazionale rispetto alla Soft in quell'arco di gara.


In evidenza la rimonta di Ricciardo nella parte centrale del grafico che ha poi alzato i suoi tempi gestendo il gap creato. Si nota anche come Vettel abbia notevolmente alzato i suoi tempi, causa il degrado della gomma Media, e  soprattutto a fine stint per danneggiamento del fondo (causato dal contatto con Verstappen).


Notiamo da questi grafici dello sviluppo del degrado che Mercedes usa meglio le mescole con un range di temperatura più alto, tra i 100° e i 140°, ben più alto rispetto a mescole come la US o la SS. Le mescole sono molto sensibili e per lavorare al meglio devono rimanere nella giusto range. Pochi gradi possono quindi cambiare significativamente la performance della vettura. Mercedes risulta avere alcuni problemi da questo punto di vista anche in gara, ma il problema è ridotto con mescole range più alti.


Questo è il grafico in cui vengono rappresentati i passi gara di Vettel, Raikkonen, Bottas e Ricciardo. Questo grafico non tiene conto de Fuel Weight Effect.


Qui, invece, il grafico rappresentante i passi gara con la correzione del Fuel Weight Effect ossia la perdita di peso dovuta al consumo di carburante durante la gara. 


Un altro grafico molto utile a visualizzare meglio il degrado effettivo che ha avuto la gomma durante la gara. 


Attraverso questa tabella si possono visualizzare le strategie usate dai piloti in gara

I TEAM MINORI 
Ora, come sempre, si prendono in esame dei grafici riguardanti alcuni team che hanno spiccato durante il Gp della Cina. I grafici prendono quindi in considerazione tutta la gara di Hulkenberg, Alonso, Magnussen e Ocon.


Qui, invece, il grafico rappresentante i passi gara con la correzione del Fuel Weight Effect ossia la perdita di peso dovuta al consumo di carburante durante la gara. 


Infine anche il grafico dello sviluppo del degrado giro per giro del secondo gruppo di piloti