ROSSO DI SERA, BEL TEMPO SI SPERA..

di Gianluca Medeot
Sakhir, 8 Aprile 2018. "Rosso di sera, bel tempo si spera" un detto popolare che calza davvero a pennello per la splendida vittoria della rossa di Sebastian Vettel, ottenuta nel crepuscolo di Sakhir.
Un weekend inaspettato e che si sarebbe potuto definire perfetto senza lo sgradevole episodio di Kimi Raikkonen ai box (il meccanico coinvolto sta bene e si muove già sulle stampelle).
Tutt'altro che perfetto invece il weekend delle frecce d'argento, che solo in gara sono riuscite ad arginare il gap delineatosi nelle prove libere e nelle qualifiche.
Andiamo dunque ad analizzare cosa si cela dietro le performance delle diverse squadre.

Per prima cosa, al fine di un analisi più chiara ed efficace, risulta fondamentale delineare le caratteristiche del circuito di Sakhir.
La pista presenta un asfalto molto abrasivo, e temperature molto alte, che aiutano le gomme ad entrare in temperatura, ma al contempo possono causare fenomeni di overheating.
Importante sottolineare che svolgendosi la gara di notte, le temperature si abbassano di molto.
Nel primo settore serve più motore e trazione, vista la presenza di due rettilinei e di due serie di curve ad angolo molto stretto nelle quali scaricare correttamente la potenza a terra è fondamentale.
La pista presenta un asfalto molto abrasivo, e temperature molto alte, che aiutano le gomme ad entrare in temperatura, ma al contempo possono causare fenomeni di overheating.
Importante sottolineare che svolgendosi la gara di notte, le temperature si abbassano di molto.
Nel primo settore serve più motore e trazione, vista la presenza di due rettilinei e di due serie di curve ad angolo molto stretto nelle quali scaricare correttamente la potenza a terra è fondamentale.
Il secondo settore richiede sempre buoni sforzi di trazione, ma in generale vi prevale il fattore downforce. Perciò risulta l'intermedio più guidato, dove è fondamentale avere il giusto bilancio aerodinamico per avere una vettura sempre rapida ed efficace nei curvoni e nei rapidi cambi di direzione.
Il terzo settore, con i suoi lunghi rettilinei, è un settore in cui l'efficienza in rettilineo (PU e Cx) è l'unico elemento davvero importante.
Il terzo settore, con i suoi lunghi rettilinei, è un settore in cui l'efficienza in rettilineo (PU e Cx) è l'unico elemento davvero importante.
 |
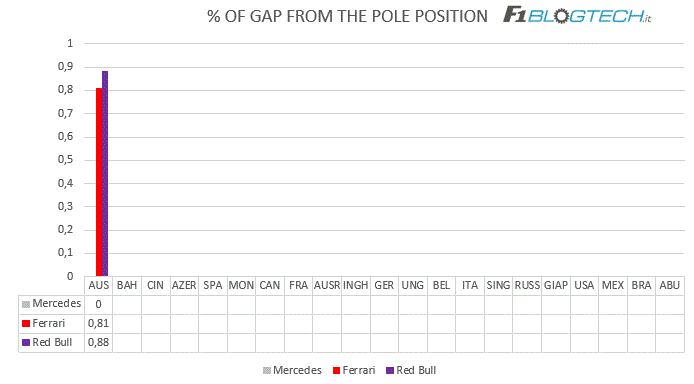
| Distacchi percentuali rispetto alla pole position (Mercedes, Red Bull e Ferrari). |
 |
| Distacchi percentuali rispetto alla pole position (Mclaren, Haas, Renault, Toro Rosso e Force India). |
Da segnalare il grande dis-equilibrio di performance presente tra i team minori e i top team, che di fatto corrono in un altro campionato.
 |
| Confronto tra il tempo segnato in Q3 e il tempo "ideale" dato dalla somma dei migliori tempi registrati nei tre settori del circuito. |
In generale i piloti hanno avuto difficoltà a mettere assieme il loro giro migliore nel momento decisivo. Hulkenberg in particolare sarebbe potuto partire sesto, scavalcando un brillante Gasly.
Hamilton invece aveva nel piede un giro identico al millesimo rispetto a quello segnato dal compagno di squadra Bottas; questo dato che delinea un'omogeneità di prestazioni tra i due piloti, rende l'analisi molto più veritiera.
 |
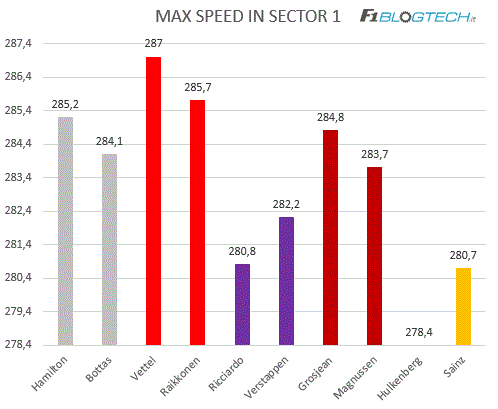
| Confronto fra le velocità massime rilevate alla speed trap e la posizione di qualifica. |
Il grafico con il confronto tra le velocità massime alla speed trap, non offre particolari spunti di analisi. Da segnalare il chiaro divario prestazionale presente tra i motorizzati Renault e gli altri competitors. Interessante notare i rilievi agli antipodi di Ocon e Hulkenberg, che ci danno conferma dell'importanza dell'efficienza aerodinamica su un circuito vario come quello di Sakhir.
Anche per questo Gp la Fom ha reso pubblico il confronto fra i micro settori dei piloti Mercedes e Ferrari più veloci (in questo caso Vettel e Bottas).


 In Australia vi avevo parlato di una Ferrari con evidenti pregi (scorrevolezza in rettilineo e trazione) ma anche con notevoli problemi nell'inserimento e nella percorrenza di curva, dati da un forte sottosterzo che si era notato già nei test invernali.
Questa volta invece, i microsettori evidenziano una Ferrari in vantaggio proprio in curve tecniche (la 1-2 , la 8, la 10 o la 13), dove è fondamentale riuscire a chiudere la curva il più possibile.
Lo stesso grafico con il distacco percentuale nel secondo settore ci fa notare che è proprio nel settore più tecnico che la Ferrari ha fatto davvero la differenza.
I motivi di tale evoluzione ci celano solo in un mirato e efficace lavoro sul set up meccanico della vettura.
 Come avevo già detto nello scorso articolo, è normale che la Ferrari possa avere qualche iniziale problema nel trovare il giusto set up, avendo rivoluzionato la filosofia costruttiva della vettura.
I problemi non sono comunque stati del tutto risolti e in Cina dovrebbe arrivare un nuovo fondo, così da aumentare il carico offerto dal corpo vettura. Altre due note dolenti riguardanti la Ferrari sono la conferma dell'elevato consumo di carburante (Vettel ha dovuto fare parecchio fuel-saving nel suo primo stint) e la sostituzione della centralina elettronica sulla vettura di Vettel (ricordo che se ne possono usare solo due in tutta la stagione).
 Passiamo ora alla Mercedes, che con la sua debacle in qualifica ha di fatto regalato a pole alla Ferrari.
Viste le alte temperature della pista, ma soprattutto a causa dell'aggressività dell'asfalto la Mercedes ha sofferto per tutto il weekend di un dannoso surriscaldamento delle coperture posteriori Supersoft.
Durante la qualifica tale problema ha rallentato parecchio le frecce d'argento, che in uscita di curva perdevano davvero tanta velocità in confronto alle Ferrari.
 In gara invece, con temperature leggermente più basse, ma soprattutto non essendoci la necessità di spingere al limite, la gestione delle posteriori è stata leggermente migliore. Sottolineo di nuovo che il problema è legato soprattutto alle caratteristiche dell'asfalto del circuito, in quanto tali problemi non si erano presentati in Australia con la SS.
 Da sottolineare il grande weekend della Toro Rosso (in particolare con Gasly), che dopo un mesto risultato in Australia, ha sfruttato a pieno gli aggiornamenti al motore, ma anche all'aerodinamica. La vettura di Faenza ha ben figurato nei rettilinei, ma soprattutto nelle sezioni guidate, evidenziando una buona efficienza aerodinamica.
Impossibile commentare il weekend della Red Bull, che solo in qualifica con Ricciardo ha potuto evidenziare una grande velocità nel secondo settore, nonostante questo mancano ancora gli elementi per poterne parlare di più.
Anche per questo Gp mi sono mantenuto abbastanza cauto nell'analisi per cadere in errore, speriamo di avere un quadro tecnico più chiaro fra qualche giorno in Cina.
Ciao e always keep pushing! ;)
 |
| Tabella con i componenti della PU usati da ogni pilota. |
 |
| Punti nel campionato costruttori. |
GRAFICI SULLA GARA ( a cura di Niccolò Arnerich)
LE SIMULAZIONI DEL VENERDÍ
- DUE STOP LA MIGLIORE IL VENERDI
Da quanto emerso il venerdì, la strategia per i piloti nelle prime posizioni sembrava essere sicuramente su due soste: si partiva con la SS usata in Q2 per poi passare alla Soft intorno al giro 14 e poi dal 43° giro andare fino al traguardo con un altro set di Soft oppure con uno di Supersoft. Dalle simulazioni la gomma da gara era la Soft, ma nell’ultimo stint, con molto meno carico di carburante, la SS avrebbe potuto avere un grosso potenziale.
-UNO STOP
La strategia ad una sola sosta Soft-Media, utilizzata da Hamilton, risultava essere inferiore proprio perché la Media non sembrava essere competitiva anche se su Mercedes questa mescola lavora sempre molto bene. Questa scelta avrebbe potuto essere molto interessante se tra il 19° e il 23°giro circa fosse uscita una SC o una VSC. Ció avrebbe significato per Hamilton, se fosse riuscito a tenere un passo molto veloce, poter fare un free-stop e trovarsi davanti al Leader se questo non fosse ancora riuscito a ricostruire la finestra di sicurezza.


LA STRATEGIA DI GARA
-LE CONDIZIONI DEL TRACCIATO
La temperatura del tracciato ha oscillato tra i 30 e 32 gradi, valori simili al venerdì.
-LO START
Perfetto lo start di Vettel che ha tenuto la prima posizione; non eccellente quello di Raikkonen che è stato sorpassato da Bottas. Il finlandese partiva dalla seconda posizione quindi dal lato sporco della pista e in un circuito come il Bahrain è un fattore che conta molto vista la sabbia che si deposita sull’asfalto.
-IL PRIMO STINT
Durante le prime fasi di gara Vettel ha tenuto un buon ritmo, tenendosi sul 35,5 contro il 35,8 di Bottas, ma da subito si è iniziato a prendere in considerazione la scelta di passare alla strategia ad una sola sosta perché Hamilton, partito con la Soft vista la penalità e volendo provare qualcosa di differente, aveva già recuperato molte posizioni arrivando a 12s dal leader.
Gli strateghi Ferrari hanno quindi deciso di andare il più lunghi possibili con la Supersoft, avendo un vantaggio di più di 3s su Bottas da gestire, e cercare di arrivare almeno al 23°giro per montare la Soft e provare ad andare fino in fondo.
Gli ingegneri Mercedes hanno poi provato ad obbligare Vettel ad andare su due soste facendo pensare di provare l’undercut con Bottas. Hanno quindi chiesto al finlandese di chiudere il gap con la prima Ferrari. Bottas al giro 19 è arrivato a 2s da Vettel, il quale non è riuscito a rispondere ai suoi tempi, e a quel punto la Mercedes è uscita in pitlane posizionandosi per il pitstop provocando lo stop della Ferrari. Il Team Italiano, minacciato dall’undercut di Bottas, ha quindi reagito richiamando il tedesco perché il finlandese era realmente un pericolo visto che si trovava a 2s e l’undercut era quindi possibile.
Vettel si è quindi messo nelle condizioni di dover fare, solo in teoria, un altro pit perché la Soft non si pensava sarebbe potuta arrivare a fine gara, e nemmeno il box Mercedes lo pensava.
A quel punto, poco dopo, al giro 20, si è fermato Bottas che ha montato la Media con cui sarebbe agevolmente arrivato a fine gara.
Hamilton è rimasto in pista ancora alcuni giri, fino al giro 26,in prima posizione, cercando di bloccare Vettel, poiché sapeva che il tedesco avrebbe dovuto fare due stint molto aggressivi per far funzionare la strategia su due soste su cui era orientato in quel momento.

Questo grafico è relativo al passo gara tenendo conto del Fuel Weight Effect ossia la perdita di peso della vettura durante lo stint dovuta al consumo di carburante. Ovviamente, meno peso significa più performance e togliendo questa variabile si visualizza meglio il degrado effettivo che ha avuto la gomma.

-IL SECONDO STINT
Nel secondo Stint su Media le due Mercedes non hanno spinto molto poiché sicure del fatto che Vettel si sarebbe fermato intorno al giro 40e avrebbe dovuto sorpassarli in pista. A Lewis è stato solo detto dal suo ingegnere Peter Bonnington di tenersi nella finestra del pitstop di Vettel, ossia sotto i 24s, assicurandosi così di stare davanti a Vettel quando quest’ultimo sarebbe uscito dal pit.
A quel punto il Team Ferrari ha deciso di andare fino in fondo reputando piú rischioso pittare e dover fare due sorpassi in pista piuttosto che restare fuori e provare a tenere la posizione senza sapere se la Soft sarebbe arrivata al cliff prima del termine della gara. Una gomma Soft, tra l’altro, che nei primi giri dello stint era stata molto stressata perché il team era ancora orientato sulle due soste e Vettel, per la riuscita del piano, doveva spingere molto.
Al giro 26 entra ai box Raikkonen,che doveva montare la SS e dare un’indicazione molto utile per la strategia di Vettel, ma purtroppo il semaforo verde al pit è stato dato troppo presto, quando la gomma posteriore sinistra usata era ancora avvitata provocando scompiglio in pit lane.
Il Box Mercedes ha quindi informato i piloti che Vettel probabilmente non si sarebbe fermato e che dovevano andarlo a prendere in pista. Hanno quindi chiesto ad Hamilton, che girava sul 35, 5, quanto poteva migliorare il suo passo per provare a recuperare il gap.
Alla fine Vettel, girando sul 35,9 rispetto al 35,3 di Bottas, è riuscito a difendersi bene negli ultimi giri quando la Mercedes è arrivata e trovando una buona trazione in tutte le curve precedenti ai rettilinei e difendendosi così fino al traguardo. Uno stint di Vettel sulla Soft gestito alla perfezione che lo ha portato a vincere.

Nel grafico del passo gara con la correzione del Fuel Wright Effect si nota come il degrado di Vettel con la gomma soft sia molto più marcato rispetto a quello di Bottas con la gomma media.

Per completare l’analisi dei piloti in test al gran premio del Bahrain, qui troviamo il grafico del passo gara complessivo di tutta la gara con la correzione dell’ Effetto Peso del Carburante.


L’evoluzione del degrado complessivo durante tutta la gara al fine di avere un quadro più chiaro dei valori in campo.

Buonissima la gara della Alfa Romeo di Ericsson che è stato molto bravo a gestire le mescole. Molto attento il Team a metterlo sulla strategia chiave della gara ossia quella a una sola sosta SS-M invece che lasciarlo sulla strategia a due soste. Si conferma la bontà della Haas e anche della Renault la quale sembra piuttosto composta, ma non riesce a fare il grande salto di qualità in gara

LE SIMULAZIONI DEL VENERDÍ
- DUE STOP LA MIGLIORE IL VENERDI
Da quanto emerso il venerdì, la strategia per i piloti nelle prime posizioni sembrava essere sicuramente su due soste: si partiva con la SS usata in Q2 per poi passare alla Soft intorno al giro 14 e poi dal 43° giro andare fino al traguardo con un altro set di Soft oppure con uno di Supersoft. Dalle simulazioni la gomma da gara era la Soft, ma nell’ultimo stint, con molto meno carico di carburante, la SS avrebbe potuto avere un grosso potenziale.
-UNO STOP
La strategia ad una sola sosta Soft-Media, utilizzata da Hamilton, risultava essere inferiore proprio perché la Media non sembrava essere competitiva anche se su Mercedes questa mescola lavora sempre molto bene. Questa scelta avrebbe potuto essere molto interessante se tra il 19° e il 23°giro circa fosse uscita una SC o una VSC. Ció avrebbe significato per Hamilton, se fosse riuscito a tenere un passo molto veloce, poter fare un free-stop e trovarsi davanti al Leader se questo non fosse ancora riuscito a ricostruire la finestra di sicurezza.


-LE CONDIZIONI DEL TRACCIATO
La temperatura del tracciato ha oscillato tra i 30 e 32 gradi, valori simili al venerdì.
-LO START
Perfetto lo start di Vettel che ha tenuto la prima posizione; non eccellente quello di Raikkonen che è stato sorpassato da Bottas. Il finlandese partiva dalla seconda posizione quindi dal lato sporco della pista e in un circuito come il Bahrain è un fattore che conta molto vista la sabbia che si deposita sull’asfalto.
-IL PRIMO STINT
Durante le prime fasi di gara Vettel ha tenuto un buon ritmo, tenendosi sul 35,5 contro il 35,8 di Bottas, ma da subito si è iniziato a prendere in considerazione la scelta di passare alla strategia ad una sola sosta perché Hamilton, partito con la Soft vista la penalità e volendo provare qualcosa di differente, aveva già recuperato molte posizioni arrivando a 12s dal leader.
Gli strateghi Ferrari hanno quindi deciso di andare il più lunghi possibili con la Supersoft, avendo un vantaggio di più di 3s su Bottas da gestire, e cercare di arrivare almeno al 23°giro per montare la Soft e provare ad andare fino in fondo.
Gli ingegneri Mercedes hanno poi provato ad obbligare Vettel ad andare su due soste facendo pensare di provare l’undercut con Bottas. Hanno quindi chiesto al finlandese di chiudere il gap con la prima Ferrari. Bottas al giro 19 è arrivato a 2s da Vettel, il quale non è riuscito a rispondere ai suoi tempi, e a quel punto la Mercedes è uscita in pitlane posizionandosi per il pitstop provocando lo stop della Ferrari. Il Team Italiano, minacciato dall’undercut di Bottas, ha quindi reagito richiamando il tedesco perché il finlandese era realmente un pericolo visto che si trovava a 2s e l’undercut era quindi possibile.
Vettel si è quindi messo nelle condizioni di dover fare, solo in teoria, un altro pit perché la Soft non si pensava sarebbe potuta arrivare a fine gara, e nemmeno il box Mercedes lo pensava.
A quel punto, poco dopo, al giro 20, si è fermato Bottas che ha montato la Media con cui sarebbe agevolmente arrivato a fine gara.
Hamilton è rimasto in pista ancora alcuni giri, fino al giro 26,in prima posizione, cercando di bloccare Vettel, poiché sapeva che il tedesco avrebbe dovuto fare due stint molto aggressivi per far funzionare la strategia su due soste su cui era orientato in quel momento.


Nel secondo Stint su Media le due Mercedes non hanno spinto molto poiché sicure del fatto che Vettel si sarebbe fermato intorno al giro 40e avrebbe dovuto sorpassarli in pista. A Lewis è stato solo detto dal suo ingegnere Peter Bonnington di tenersi nella finestra del pitstop di Vettel, ossia sotto i 24s, assicurandosi così di stare davanti a Vettel quando quest’ultimo sarebbe uscito dal pit.
A quel punto il Team Ferrari ha deciso di andare fino in fondo reputando piú rischioso pittare e dover fare due sorpassi in pista piuttosto che restare fuori e provare a tenere la posizione senza sapere se la Soft sarebbe arrivata al cliff prima del termine della gara. Una gomma Soft, tra l’altro, che nei primi giri dello stint era stata molto stressata perché il team era ancora orientato sulle due soste e Vettel, per la riuscita del piano, doveva spingere molto.
Al giro 26 entra ai box Raikkonen,che doveva montare la SS e dare un’indicazione molto utile per la strategia di Vettel, ma purtroppo il semaforo verde al pit è stato dato troppo presto, quando la gomma posteriore sinistra usata era ancora avvitata provocando scompiglio in pit lane.
Il Box Mercedes ha quindi informato i piloti che Vettel probabilmente non si sarebbe fermato e che dovevano andarlo a prendere in pista. Hanno quindi chiesto ad Hamilton, che girava sul 35, 5, quanto poteva migliorare il suo passo per provare a recuperare il gap.
Alla fine Vettel, girando sul 35,9 rispetto al 35,3 di Bottas, è riuscito a difendersi bene negli ultimi giri quando la Mercedes è arrivata e trovando una buona trazione in tutte le curve precedenti ai rettilinei e difendendosi così fino al traguardo. Uno stint di Vettel sulla Soft gestito alla perfezione che lo ha portato a vincere.

Questo è un altro grafico molto utile per capire come il degrado si evolve durante lo stint. Si evince come Vettel ha effettivamente degradato molto la gomma SS alla fine dello stint e non ha potuto tenere a distanza Bottas
 |
| Strategia di gara |
Per completare l’analisi dei piloti in test al gran premio del Bahrain, qui troviamo il grafico del passo gara complessivo di tutta la gara con la correzione dell’ Effetto Peso del Carburante.